Four accounts. All with
the dashboards attached.

Two US contractors with revenue tracked through to closed deals, a California pest control company, and a Portuguese port house entering the US. Every number traces to a screenshot — and where a dashboard flatters itself, we say so and report the lower figure.

Read this first

Four accounts, all American, all shown with their dashboards.

Each has a dated starting point, each is backed by a screenshot of the actual account, and where a figure does not reconcile we say so on the page rather than quietly dropping it.

All four are United States accounts, managed by our founder at a previous US agency: a plumbing contractor, a protective coatings contractor, a California pest control company, and a Portuguese port house selling into the US. None is South African — the coatings account, at roughly $2,000 a month of Google Ads spend, is the closest in size to a local budget.

What that means if you are a South African service business. The mechanics carry over — how leads are counted, how waste is removed, how a cost per acquisition is brought down. The absolute numbers will not. Two of these four report a lower headline number than the client's own dashboard does, and both explain why.

What the four add up to. $1,442,791 of client revenue on $243,146 of tracked ad spend — a blended 5.93× — across the three accounts where revenue is tracked. The pest control account has no revenue tracking, so it contributes conversions and a halved cost per lead but no revenue. Coatings is counted on its paid channels only, which is why its contribution is $159,310 and not the $261,340 its all-channel dashboard shows. Every component of that total is on this page with a screenshot beside it.

US account · USD

Plumbing Contractor · United States

Plumbing Company, Closed-Loop Revenue

6.83× ROAS on Search

$1.27MRevenue, all channels
$204KAd spend, all channels
377Deals closed
6.20×Blended ROAS
1,542 leads377 closed deals$1,266,481

A 24.4% blended close rate at a $132 blended cost per lead. Google Ads Search on its own produced $1,046,595 from $153,328 — a 6.83× return, 974 leads, 308 closed deals, and a 31.6% close rate.

This is the only case study here with real revenue

The client runs ServiceTitan, so every lead can be followed through to a closed deal and an invoice. The revenue figures above are not modelled, not proxied from average job value, and not a conversion value we assigned in Google Ads. They are what the business actually billed, matched back to the channel that produced the lead.

That distinction matters more than the numbers. Any agency can report conversions. Reporting the revenue those conversions became, from the client's own job-management system, is a different claim.

What closed-loop tracking revealed — and it was counterintuitive

Local Services Ads produced the cheapest leads in the account: $86 each, against $157 on Search. On cost per lead alone, LSA was the obvious place to move budget.

It was the worst buy in the account. Those cheap leads closed at 11.0% against Search's 31.6% — roughly a third of the rate. Revenue per lead came in at $359 against $1,075, so a Search lead was worth three times as much despite costing 82% more. LSA returned 4.19×; Search returned 6.83×.

Had that $47,429 of Local Services budget performed at Search efficiency, it would have produced about $324,000 rather than $198,927. Optimising toward cheap leads would have actively cost this client money, and there is no way to see that without revenue tracked to the close.

The efficiency shift in Google Ads

Comparing two matched 236-day windows: spend fell 20%, conversions rose 35%, and cost per conversion fell 41% from $255 to $151. All four figures in the account screenshot reconcile exactly against each other.

The mechanism was the click price. Average CPC went from $34.45 to $18.76 — down 46%. Worth being straight about the trade-off: conversion rate slipped slightly, from 13.50% to 12.43%, so the cheaper clicks converted a little less well. The click price fell faster than the conversion rate did, which is why the cost per conversion still dropped by more than 40%.

Where the caution belongs

Bing shows the highest close rate in the table at 57.1% and a 6.03× return — on 14 leads and 8 deals. That is far too small a sample to act on, and it is quoted here only because it is in the data, not because it means anything yet.

Account screenshots

Channel performance table: Google Ads Search $153,328 spend, 974 leads, $157 CPL, 308 deals closed, 31.6% close rate, $1,046,595 revenue, 6.83 ROAS; Bing Ads Search 6.03 ROAS; Google Ads Local Services $86 CPL, 11% close rate, 4.19 ROAS.
Channel performance with ServiceTitan revenue attached: spend, leads, cost per lead, deals closed, close rate, revenue and return, per channel.
Google Ads overview, 1 January to 25 August 2026 compared with 9 May to 31 December 2025: clicks 8.69K up 2.78K, conversions 1.08K up 281.90, cost per conversion $151 down $104, cost $163K down $40.6K.
Google Ads, 1 Jan – 25 Aug 2026 against 9 May – 31 Dec 2025. Spend down $40.6K, conversions up 281.90, cost per conversion down $104.

No client, account or customer identifiers appear in either view. We do not publish client account data.

US account · USD

Protective Coatings Contractor · United States

Coatings Company, Scaling While Improving

5.79× on paid spend

+82%Ad spend
+242%Conversions
−47%Cost per conversion
5.79×Return on paid spend
$27,510 paid spend$159,310 revenue=5.79×

Google Ads Search returned 5.80× and Local Services 5.79× — near-identical, which is unusual and worth noting. Revenue per lead was $1,298 on Search and $872 on Local Services.

We are reporting a lower number than the dashboard does

The client's reporting dashboard shows a blended return of 9.50× across all channels. We are not using that figure, because $102,030 of the $261,340 it counts came from Google Business Profile and organic search — channels with zero ad spend.

Crediting paid advertising with revenue it did not buy would make the number roughly 64% larger and entirely misleading. On the $27,510 that was actually spent, the return was 5.79×. That is the number on this page.

The interesting part: they paid more per click, not less

Comparing two matched 236-day windows, cost per conversion fell 47%, from $229 to $122 — while spend rose 82%. Scaling and improving efficiency at the same time is the hardest combination to pull off, because the usual way to grow spend is to buy cheaper, worse traffic.

The mechanism here was the reverse. Average cost per click went up 44%, from $8.95 to $12.93. What moved was the conversion rate: 3.90% to 10.57%, nearly tripling. The account stopped buying cheap clicks and started buying the right ones.

All four figures in the Google Ads screenshot reconcile exactly against each other, in both the current and the prior window.

What the free channels tell you anyway

Google Business Profile produced 181 leads — more than either paid channel — at no media cost. Organic produced another 48. That is worth knowing for two reasons: it means the paid channels are not the only thing working, and it means the blended figures in any all-channel dashboard need unpicking before they mean anything.

Account screenshots

Google Ads overview, 1 January to 25 August 2026 compared with 9 May to 31 December 2025: clicks 1.23K up 255, conversions 130 up 92, cost per conversion $122 down $107, cost $15.9K up $7.17K.
Google Ads, 1 Jan – 25 Aug 2026 against 9 May – 31 Dec 2025. Spend up $7.17K, conversions up 92, cost per conversion down $107.
Revenue dashboard by channel: Google Ads Search $15.9K spend, 71 leads, 13 deals, $92.14K revenue, 5.80 ROAS; Google Ads Local Services $11.61K spend, $67.17K revenue, 5.79 ROAS; Google Business Profile and Organic at zero spend contributing $51.9K and $50.13K.
Revenue by channel. Note the two $0-spend rows: Google Business Profile and Organic contribute $102,030 of the $261,340 total, which is why the 9.50× grand-total figure is not the paid return.

Client name masked in the dashboard. We do not publish client identifiers.

US account

Bee & Wasp Removal · Greater Los Angeles

Pest Control Company, California
CPL: $70+ → ~$35

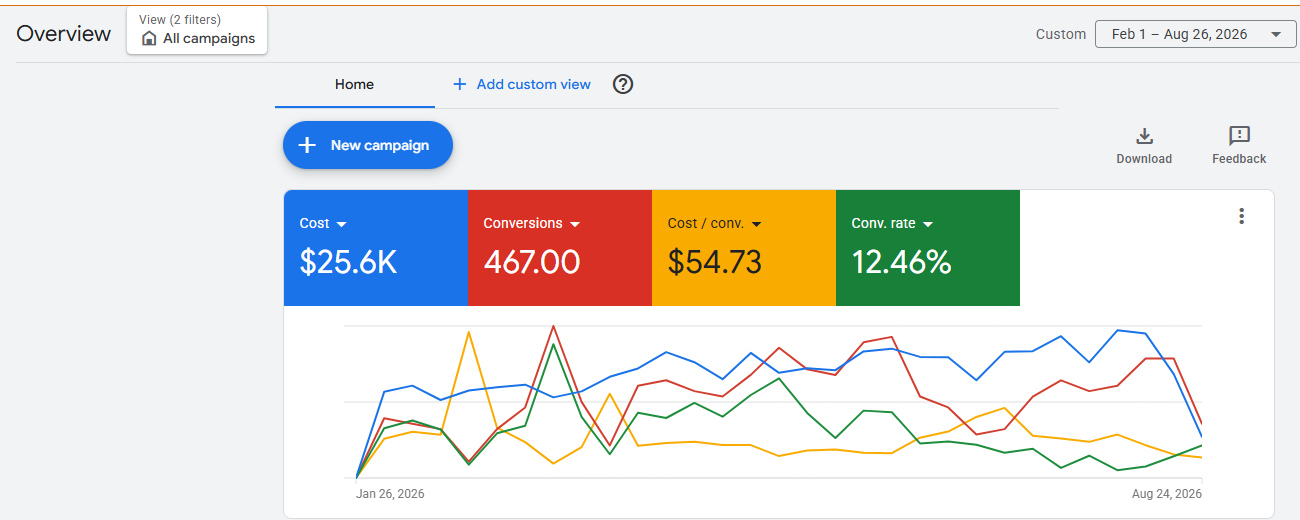
467Conversions
$54.73Blended cost per lead
12.46%Conversion rate
$25.6KAd spend, Feb–Aug
$70+ per lead~$35 per lead2× the leads, same budget

At $70 a lead, the account's ~$3,780 monthly budget bought about 54 leads. At $35 it buys about 108. Put differently: had the cost per lead stayed where it started, $25,600 would have produced roughly 366 leads. It produced 467 — 101 extra leads for the same money, with the gap still widening.

The client

Demanding, and reasonably so. They wanted results from day one and were benchmarking against their pre-COVID numbers — a bar set in a different market, with different competition and different costs. For the first stretch we were fielding complaints roughly every week.

What we did not do

We did not chase the complaint. Loosening match types and buying cheaper clicks would have made the lead count jump and the cost per lead fall on paper, and it would have filled their phones with people who were never going to book. Instead the account was rebuilt around one question: what does a real first-time customer look like, and how do we buy more of exactly that?

How the leads are counted — this is the part that matters

Every lead is tracked in CallRail. A conversion is only counted for a first-time caller or a form submission. Repeat customers and abandoned calls are excluded, and only calls a human has marked as qualified get imported back into Google Ads as conversions.

That is why the numbers below do not agree, and why they should not: CallRail logged 539 contacts from Google Ads over the period — 480 calls and 59 forms — while Google Ads counts 467 conversions. Thirteen percent of the raw contact volume is deliberately not counted. Most reporting works the other way.

Where it stands

Cost per lead has halved. The weekly complaints stopped. The account now runs on a mix of Performance Max and Search, with 89% of all leads arriving as phone calls — which is what a bee removal business actually looks like, and why the whole account is built around the phone rather than the form.

What is next

Offline conversion imports are being implemented now, so the account will optimise against booked revenue rather than lead count. That is the step that changes the question from "what did a lead cost?" to "what did a customer earn?", and it is where this account goes from working to compounding.

Account screenshots

Google Ads overview for the account, 1 February to 26 August 2026: cost $25.6K, conversions 467, cost per conversion $54.73, conversion rate 12.46%.
Google Ads, 1 Feb – 26 Aug 2026. $25.6K spend, 467 conversions, $54.73 cost per conversion, 12.46% conversion rate.
CallRail weekly call volume from Google Ads, January to August 2026, totalling 480 calls across three tracking pools.
CallRail: 480 calls from Google Ads, split across Google Ads assets, Google Business Profile and the website pool. Near zero until late February, climbing from mid-March.
CallRail weekly form submission volume from Google Ads, January to August 2026, totalling 59 forms.
CallRail: 59 form submissions from Google Ads. The first arrived in April and volume only became consistent from May — the phone carried this account from week four.

Customer contact details have been cropped from the CallRail screenshots and the client name masked. We do not publish client or customer data.
US market · USD

Premium Port Wine · Portugal → United States

Port Wine House, US Market Entry

ROAS 0.64× → 1.49×

+119%Revenue
+63%Orders
−42%Cost per order
−6%Ad spend
$12,090 → 49 ordersthen$11,400 → 80 orders

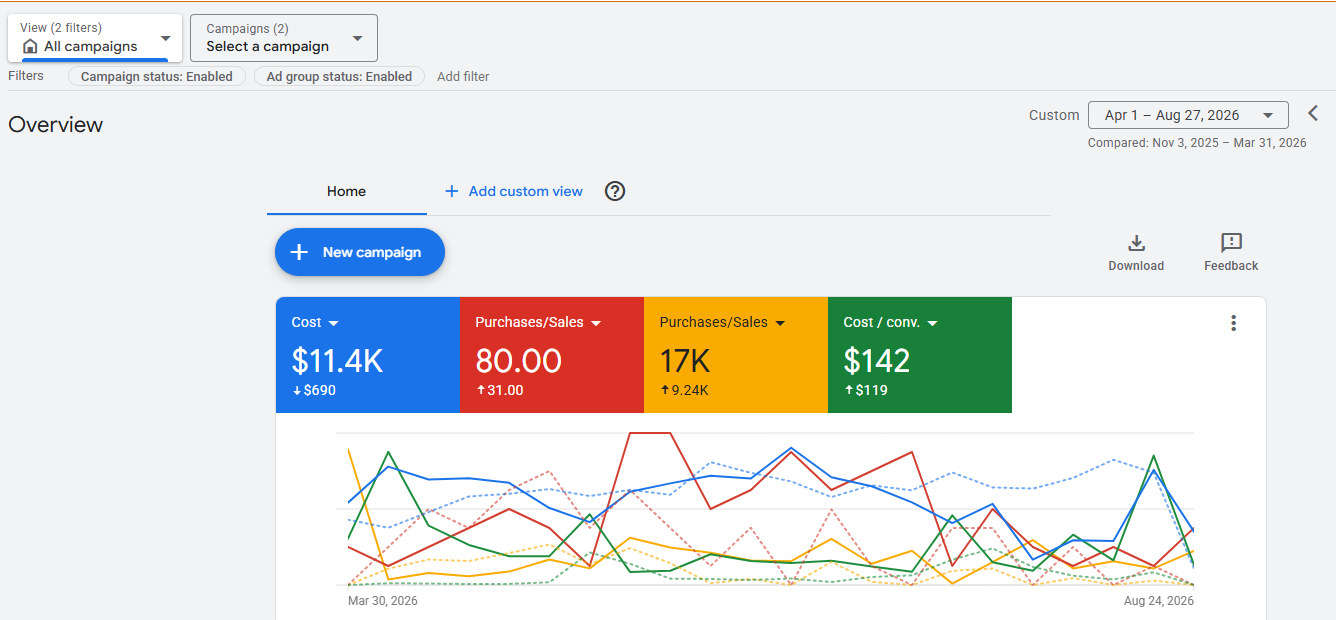
Two matched 148-day windows. Spend went down $690. Orders went up 63%, revenue went up 119%, and average order value rose 34% from $158 to $213 — so the account did not just buy more orders, it bought bigger ones. Cost per order fell from $246.73 to $142.50.

The situation

A Portuguese port house with real heritage at home and effectively zero brand awareness in the United States, entering the market recently on about $2,300 a month across two campaigns. No US search history to bid against, no existing customer base to remarket to, and a product most American buyers think of once a year.

Why this category is harder than it looks

Alcohol is restricted content on Google. Under Google's alcohol policy, ads for the online sale of alcohol may only run in approved locations, targeting anyone below the legal drinking age is prohibited, and several formats are simply unavailable — dynamic search ads, Gmail ads, Discovery ads, app install ads and others are all off the table. On top of the platform rules sit the American state-by-state direct-to-consumer shipping laws, which decide where a bottle can legally be sent at all.

The practical consequence is that a lot of the usual growth levers do not exist here. What is left is search intent, shopping feed quality, and knowing exactly which geography can actually receive an order.

Read the dates before the numbers

The earlier window runs 3 November to 31 March. It contains Christmas — and port is a gifting product whose year is weighted heavily toward the festive season. The later window, 1 April to 27 August, is the off-season.

So the comparison is not flattering to the newer period; it is the opposite. Revenue more than doubled in port's quietest five months, measured against a period containing its busiest. A like-for-like seasonal comparison would show a wider gap, not a narrower one.

Where it stands

The account crossed 1.0×. At 0.64× every dollar of ad spend returned 64 cents and paid traffic was subsidised by the rest of the business. At 1.49× it pays for itself and contributes. That is the threshold that matters far more than the percentage improvement either side of it.

Account screenshot

Google Ads overview, 1 April to 27 August 2026 compared with 3 November 2025 to 31 March 2026: cost $11.4K down $690, purchases 80 up 31, purchase value 17K up 9.24K.
Google Ads, 1 Apr – 27 Aug 2026 against 3 Nov 2025 – 31 Mar 2026. Cost $11.4K (down $690), 80 purchases (up 31), $17K purchase value (up $9.24K).

Account name, manager account reference and account number cropped before publication. We do not publish client account identifiers.

How we report these numbers

The rules we hold ourselves to.

Paid channels only. Where a client's dashboard blends paid advertising with free traffic, we strip the free channels out. On the coatings account that takes the reported return from 9.50× down to 5.79×, because $102,030 of the revenue came from Google Business Profile and organic search.

Columns that don't reconcile don't get published. Two of these accounts have a revenue-per-job column that does not equal revenue divided by deals closed. We do not know why, so we do not use it. One has a close-rate column computed on a different lead base than its own lead column — so no close rate from that dashboard appears here.

Where there is no starting point, we say so. A large number with no baseline shows you scale, not skill. Every account on this page has a dated comparison window, and the windows are matched in length.

Revenue means what the client's system recorded. Not modelled, not proxied from an average job value, not a figure we assigned inside Google Ads. Where revenue is not tracked at all — the pest control account — we report conversions and cost per lead, and no return.

All figures are in US dollars and are not portfolio totals. Client names, account numbers and customer contact details are cropped or masked out of every screenshot before publication.

Seven things worth
looking at directly.

Charts only where there is something real to compare — a genuine before and after, or a difference between channels that changes a spending decision.

Revenue per lead, by channelServiceTitan revenue traced back to the channel that produced the lead
Revenue per lead, by channel. ServiceTitan revenue traced back to the channel that produced the lead Bing Ads · Search: $1,497 Bing Ads · Search $1,497 Google Ads · Search: $1,075 Google Ads · Search $1,075 Local Services: $359 Local Services $359

Local Services produced the cheapest leads in the account at $86 and the least revenue per lead at $359. Search leads cost 82% more and returned three times as much. Bing is highest per lead but on only 14 leads — too small a sample to act on.

View as table
Revenue per lead, by channel
Bing Ads · Search$1,497
Google Ads · Search$1,075
Google Ads · Local Services$359
Cost per conversion, before and afterMatched 236-day windows, Google Ads
Cost per conversion, before and after. Matched 236-day windows, Google Ads May – Dec 2025: $255 May – Dec 2025 $255 Jan – Aug 2026: $151 Jan – Aug 2026 $151

Down 41%, while spend fell 20% and conversions rose 35%. The mechanism was the click price: average CPC fell from $34.45 to $18.76.

View as table
Cost per conversion, before and after
May – Dec 2025$255
Jan – Aug 2026$151
Where the revenue actually came fromSame eight months, revenue split by channel
Where the revenue actually came from. Same eight months, revenue split by channel Search — $15.9K: $92,140 Search — $15.9K $92,140 Local Services — $11.6K: $67,170 Local Services — $11.6K $67,170 Business Profile — $0: $51,900 Business Profile — $0 $51,900 Organic — $0: $50,130 Organic — $0 $50,130

The two lighter bars cost nothing to run. Together they account for $102,030 of the $261,340 total — which is why the paid return is 5.79×, not the 9.50× the dashboard reports across all channels.

View as table
Where the revenue actually came from
Search — $15.9K$92,140
Local Services — $11.6K$67,170
Business Profile — $0$51,900
Organic — $0$50,130
Cost per conversion, before and afterMatched 236-day windows, Google Ads
Cost per conversion, before and after. Matched 236-day windows, Google Ads May – Dec 2025: $229 May – Dec 2025 $229 Jan – Aug 2026: $122 Jan – Aug 2026 $122

Down 47% — while spend rose 82%. The click price went up 44%; the conversion rate nearly tripled, from 3.90% to 10.57%.

View as table
Cost per conversion, before and after
May – Dec 2025$229
Jan – Aug 2026$122
Cost per lead: February to nowBee & wasp removal, Greater Los Angeles
Cost per lead: February to now. Bee & wasp removal, Greater Los Angeles February (start): >$70 February (start) >$70 Feb–Aug blended average: $54.73 Feb–Aug blended average $54.73 Current: ~$35 Current ~$35

The blended average sits between the start and current figures, which is what a falling cost per lead looks like when averaged across the whole period. Start and current figures reported by the account manager; the $54.73 blended average is from the Google Ads screenshot below.

View as table
Cost per lead: February to now
February (start)>$70
Feb–Aug blended average$54.73
Current~$35
Return on ad spend, before and afterMatched 148-day windows
Return on ad spend, before and after. Matched 148-day windows Nov 2025 – Mar 2026: 0.64× Nov 2025 – Mar 2026 0.64× Apr – Aug 2026: 1.49× Apr – Aug 2026 1.49×

Crossing 1.0× is the line between paid traffic costing more than it returned and paid traffic paying for itself. Derived from the spend and conversion-value figures in the screenshot below.

View as table
Return on ad spend, before and after
Nov 2025 – Mar 20260.64×
Apr – Aug 20261.49×
Cost per order, before and afterSame two windows, same account
Cost per order, before and after. Same two windows, same account Nov 2025 – Mar 2026: $246.73 Nov 2025 – Mar 2026 $246.73 Apr – Aug 2026: $142.50 Apr – Aug 2026 $142.50

Spend divided by completed orders. This is shown instead of the Cost/conv tile in the screenshot, which does not reconcile with the other three tiles — see the note on the case study.

View as table
Cost per order, before and after
Nov 2025 – Mar 2026$246.73
Apr – Aug 2026$142.50

Ready to turn your ad budget
into booked jobs?

Request a free, no-obligation Google Ads audit. We'll show you what's working, what's wasted, and what your competitors are doing that you're not.